• Baccarat Analysis for Casinos (Excel)

    Excelpunks is proud to offer the Baccarat Analysis for Casinos (Excel) spreadsheet.

    Baccarat Analysis for Casinos (Excel)

    $3,000.00

    The system is lightweight and provides the discerning surveillance analyst the following information on a baccarat game:

    1. Bias of the shoe towards each result
    2. Wager fluctuation between winning and losing wagers
    3. 1st Card advantage analysis
    4. Comparison of the player’s winning hands versus the normal
    5. Comparison of the player’s overall win/loss versus the normal

    Using 6 levels of alerts based on mathematical principles and standard deviation, the system will give you a comprehensive perspective on baccarat play.

    Customization is possible, so do get in touch with us at: excelpunks@gmail.com

  • In this article, we shall go over the various components of baccarat:

    1. Effect of individual cards on probability
    2. Effect of different card combinations in a coup

    Effect of individual cards on probability

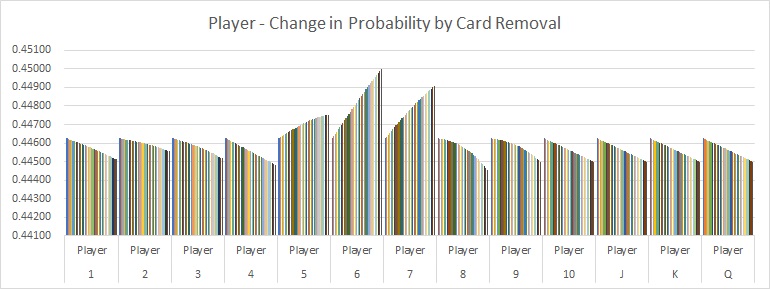
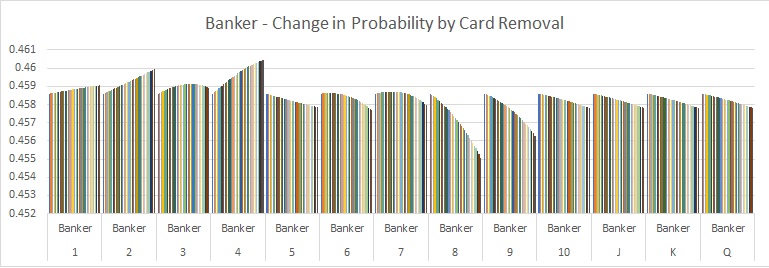
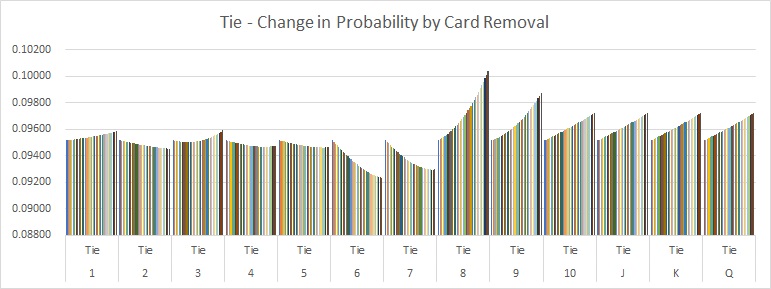
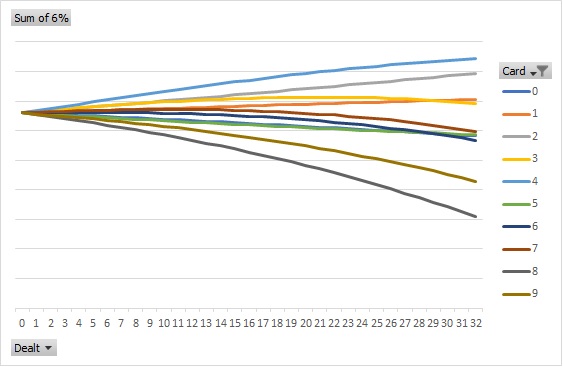
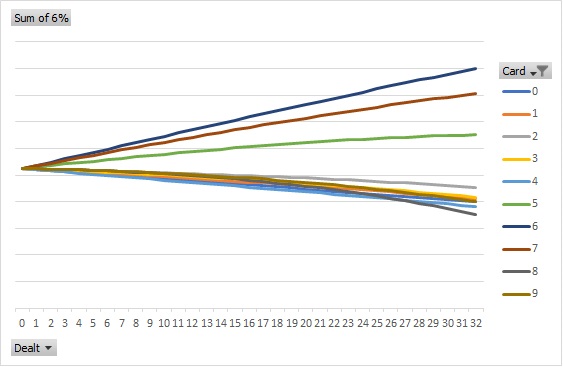
    The following 3 line-charts show the effect of removing each value of card on the probabilities on the next hand of the Banker, Player and Tie. You will notice that different card values have different effects on the probability of the next hand.

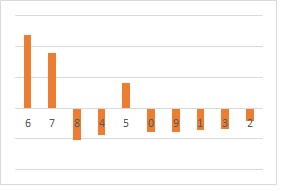
    Running a regression analysis on each line, the following respective 3 bar-charts indicate the quantifiable effects on probability.

    Banker

    Banker (card removal)

    Banker (regression line)

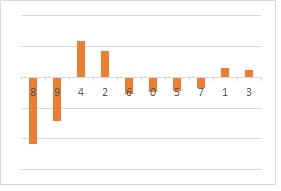
    These charts show that removing 4s and 2s have the largest positive effect on the probability of a Banker result, while removing 8s and 9s have the largest negative effect on the probability of a Banker result.

    Player

    Player (card removal)

    Player (regression line)

    These charts show that removing 6s and 7s have the largest positive effect on the probability of a Player result, while removing 8s and 4s have the largest negative effect on the probability of a Player result.

    Tie

    Tie (card removal)

    Tie (regression line)

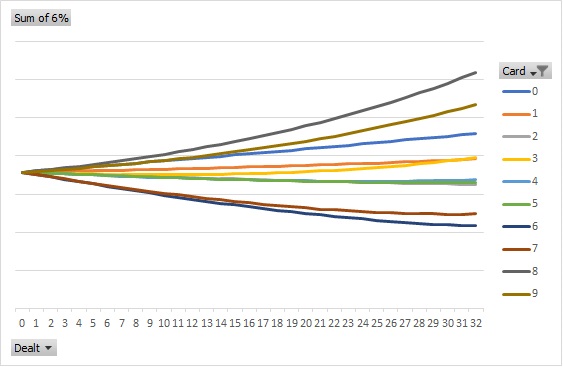
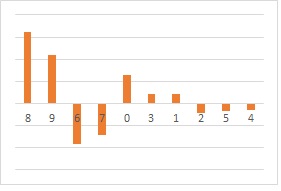
    These charts show that removing 8s and 9s have the largest positive effect on the probability of a Tie result, while removing 6s and 7s have the largest negative effect on the probability of a Tie result.

    Effect of different card combinations in a coup

    The reason for these differences can be traced directly to the composition of each possible coup. From combinatorics, we know that each hand in baccarat is formed from 6 cards. While there are 4 and 5-card coups, mathematically, the total number of possible outcomes from a 6-card game is necessarily calculated using 6 cards by default.

    This is how we get the total possible outcomes in baccarat: 416! / (410! x 6!)

    ! means a factorial. This means 416 x 415 x 414 x 413 x 412 x 411 = 4,998,398,275,503,360 possible 6-card coups in baccarat.

    The number of permutations of each coup is calculated by multiplying the number of total remaining cards of each value by the subsequent card.

    For example, a hand consisting of 6 cards of different values from a new shoe would be (not counting the burn procedure, for simplicity) 32 x 32 x 32 x 32 x 32 x 32 or 32^6. A hand of consisting of 2 same value cards and 4 different value cards would be 32 x 31 x 32 x 32 x 32 x 32 or 32!/30! x 32^4.

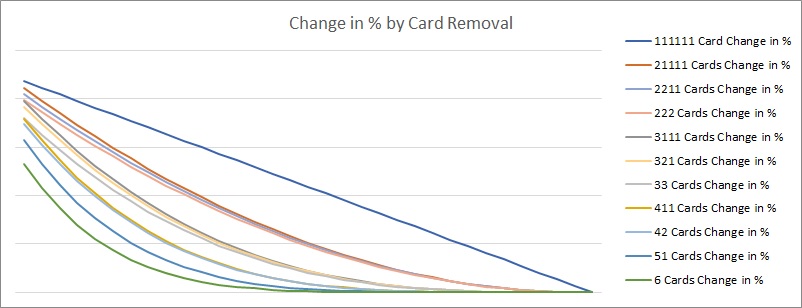
    This would mean that results which consist of an overall higher occurrence of 6 different value cards would have a higher probability of occurring. The following chart elaborates on this.

    Card Combinations

    If you would like to know more, do get in touch at excelpunks@gmail.com.

    Good luck!


  • Hi friends,

    This topic follows the study on the most beneficial cards to the Player, Banker and Tie wagers in Baccarat.

    The 3 tables below show the effect on the probabilities of the Player, Banker and Tie as 1, 2 and 3 cards are removed in isolation from each card value. Do take note of the changes in probability as each card is removed and their relationship to the respective wager.

    Player

    Card Value: Permutations Player Win % Compared to Other Wagers Player Win % by Card Value Effect of 1 Card Removed Effect of 2 Cards Removed Effect of 3 Cards Removed
    4    1,036,330,148,130,820 44.9220% 7.7436% –                   0.0000435175 –                     0.0000870460 –                     0.0001305855
    0    1,035,362,791,243,780 44.8801% 7.7363% –                   0.0000373810 –                     0.0000749287 –                     0.0001126377
    J    1,035,362,791,243,780 44.8801% 7.7363% –                   0.0000373810 –                     0.0000749287 –                     0.0001126377
    Q    1,035,362,791,243,780 44.8801% 7.7363% –                   0.0000373810 –                     0.0000749287 –                     0.0001126377
    K    1,035,362,791,243,780 44.8801% 7.7363% –                   0.0000373810 –                     0.0000749287 –                     0.0001126377
    1    1,034,132,990,550,020 44.8268% 7.7272% –                   0.0000295798 –                     0.0000594307 –                     0.0000895596
    3    1,032,891,882,528,770 44.7730% 7.7179% –                   0.0000217068 –                     0.0000440304 –                     0.0000669774
    2    1,031,651,228,684,290 44.7192% 7.7086% –                   0.0000138368 –                     0.0000279871 –                     0.0000424652
    9    1,031,234,689,822,720 44.7012% 7.7055% –                   0.0000111945 –                     0.0000236585 –                     0.0000374332
    8    1,030,998,408,818,690 44.6909% 7.7037% –                   0.0000096956 –                     0.0000214609 –                     0.0000353579
    5    1,020,528,719,052,800 44.2371% 7.6255%                      0.0000567188                        0.0001128483                        0.0001683503
    7    1,013,469,785,956,350 43.9311% 7.5728%                      0.0001014971                        0.0002024677                        0.0003028843
    6    1,010,420,677,033,980 43.7989% 7.5500%                      0.0001208391                        0.0002418228                        0.0003629233

    Banker

    Card Value: Permutations Banker Win % Compared to Other Wagers Banker Win % by Card Value Effect of 1 Card Removed Effect of 2 Cards Removed Effect of 3 Cards Removed
    8    1,067,894,055,137,280 46.2902% 7.7645% –                   0.0000629994 –                     0.0001283117 –                     0.0001959930
    9    1,063,659,370,418,180 46.1067% 7.7337% –                   0.0000361367 –                     0.0000740128 –                     0.0001136737
    5    1,062,272,823,181,310 46.0466% 7.7236% –                   0.0000273411 –                     0.0000544194 –                     0.0000812294
    0    1,061,053,355,229,180 45.9937% 7.7148% –                   0.0000196054 –                     0.0000395286 –                     0.0000597675
    J    1,061,053,355,229,180 45.9937% 7.7148% –                   0.0000196054 –                     0.0000395286 –                     0.0000597675
    Q    1,061,053,355,229,180 45.9937% 7.7148% –                   0.0000196054 –                     0.0000395286 –                     0.0000597675
    K    1,061,053,355,229,180 45.9937% 7.7148% –                   0.0000196054 –                     0.0000395286 –                     0.0000597675
    6    1,056,701,970,653,180 45.8051% 7.6831%                      0.0000079976                        0.0000143452                        0.0000189833
    1    1,055,563,635,941,380 45.7557% 7.6749%                      0.0000152186                        0.0000304640                        0.0000457306
    7    1,054,846,110,916,610 45.7246% 7.6696%                      0.0000197702                        0.0000379094                        0.0000543471
    2    1,051,591,007,948,800 45.5835% 7.6460%                      0.0000404189                        0.0000808770                        0.0001213820
    3    1,050,791,343,448,060 45.5489% 7.6402%                      0.0000454916                        0.0000893156                        0.0001314284
    4    1,045,981,660,065,790 45.3404% 7.6052%                      0.0000760018                        0.0001513286                        0.0002259417

    Tie

    Card Value: Permutations Tie % Compared to Other Wagers Tie % by Card Value Effect of 1 Card Removed Effect of 2 Cards Removed Effect of 3 Cards Removed
    6       239,830,402,545,152 10.3960% 8.4040% –                   0.0001288367 –                     0.0002561680 –                     0.0003819067
    7       238,637,153,359,360 10.3443% 8.3622% –                   0.0001212674 –                     0.0002403772 –                     0.0003572314
    4       224,641,242,035,712 9.7376% 7.8718% –                   0.0000324844 –                     0.0000642826 –                     0.0000953562
    5       224,151,507,998,208 9.7163% 7.8546% –                   0.0000293777 –                     0.0000584289 –                     0.0000871209
    2       223,710,813,599,232 9.6972% 7.8391% –                   0.0000265822 –                     0.0000528899 –                     0.0000789169
    3       223,269,824,255,488 9.6781% 7.8237% –                   0.0000237848 –                     0.0000452853 –                     0.0000644510
    1       217,256,423,740,928 9.4175% 7.6130%                      0.0000143612                        0.0000289667                        0.0000438290
    9       212,058,989,991,424 9.1922% 7.4309%                      0.0000473311                        0.0000976713                        0.0001511069
    0       210,536,903,759,360 9.1262% 7.3775%                      0.0000569865                        0.0001144573                        0.0001724053
    J       210,536,903,759,360 9.1262% 7.3775%                      0.0000569865                        0.0001144573                        0.0001724053
    Q       210,536,903,759,360 9.1262% 7.3775%                      0.0000569865                        0.0001144573                        0.0001724053
    K       210,536,903,759,360 9.1262% 7.3775%                      0.0000569865                        0.0001144573                        0.0001724053
    8       208,060,586,276,352 9.0188% 7.2907%                      0.0000726950                        0.0001497726                        0.0002313508

    In summary, you will notice that shoes with a higher number of certain card values remaining will lead to a better probability on specific wagers. The following table shows the simplified effect of removal of each card value on the respective probabilities of the Player, Banker and Tie wagers:-​

    Effect of Removal on Probability by Card Value
    Wager 1 2 3 4 5 6 7 8 9 0
    Player  – + + +
    Banker + + + + + (- from removal of card 6) + (-from removal of card 12)
    Tie +

    (+ from Removal of card 20)

    + + +

    In other words:

    1. For the Player, it would be advantageous to have as many 5s, 6s and 7s removed from the shoe as possible and to keep the rest in.
    2. For the Banker, removal of the 1s through to 4s and 6s and 7s would be advantageous. Do note the peculiarities at card 6 for 6 and card 12 for 7.
    3. For Tie, removal of the 1s and 8s through to Ks would be advantageous. Do note the peculiarity at card 20 for 3.

    The 3 charts below show the effect on probability as 1 to 32 cards of each value are removed.

    Player

    Concepts 16 Player

    Banker

    Concepts 16 Banker

    Tie

    Concepts 16 Tie

    Good luck!

  • Friends,

    The following 3 tables show the most beneficial cards for each wager.
    This was calculated by observing the number of times the presence of cards of these values led to a Player, Banker or Tie result.
    They are sorted in descending order of effect by card value. Some of the results are intuitive, others may surprise.

    Column 3: Player Win % Compared to Other Wagers compares the effect the card value has on a wager as compared to the other wagers, in this instance, Banker and Tie.

    Column 4: Player Win % by Card Value compares that card value’s effect as compared to all other card values for that particular wager.

    Player

    Card Value: Permutations Player Win % Compared to Other Wagers Player Win % by Card Value
    4    1,036,330,148,130,820 44.9220% 7.7436%
    0    1,035,362,791,243,780 44.8801% 7.7363%
    J    1,035,362,791,243,780 44.8801% 7.7363%
    Q    1,035,362,791,243,780 44.8801% 7.7363%
    K    1,035,362,791,243,780 44.8801% 7.7363%
    1    1,034,132,990,550,020 44.8268% 7.7272%
    3    1,032,891,882,528,770 44.7730% 7.7179%
    2    1,031,651,228,684,290 44.7192% 7.7086%
    9    1,031,234,689,822,720 44.7012% 7.7055%
    8    1,030,998,408,818,690 44.6909% 7.7037%
    5    1,020,528,719,052,800 44.2371% 7.6255%
    7    1,013,469,785,956,350 43.9311% 7.5728%
    6    1,010,420,677,033,980 43.7989% 7.5500%

    Banker

    Card Value: Permutations Banker Win % Compared to Other Wagers Banker Win % by Card Value
    8    1,067,894,055,137,280 46.2902% 7.7645%
    9    1,063,659,370,418,180 46.1067% 7.7337%
    5    1,062,272,823,181,310 46.0466% 7.7236%
    0    1,061,053,355,229,180 45.9937% 7.7148%
    J    1,061,053,355,229,180 45.9937% 7.7148%
    Q    1,061,053,355,229,180 45.9937% 7.7148%
    K    1,061,053,355,229,180 45.9937% 7.7148%
    6    1,056,701,970,653,180 45.8051% 7.6831%
    1    1,055,563,635,941,380 45.7557% 7.6749%
    7    1,054,846,110,916,610 45.7246% 7.6696%
    2    1,051,591,007,948,800 45.5835% 7.6460%
    3    1,050,791,343,448,060 45.5489% 7.6402%
    4    1,045,981,660,065,790 45.3404% 7.6052%

    Tie

    Card Value: Permutations Tie % Compared to Other Wagers Tie % by Card Value
    6       239,830,402,545,152 10.3960% 8.4040%
    7       238,637,153,359,360 10.3443% 8.3622%
    4       224,641,242,035,712 9.7376% 7.8718%
    5       224,151,507,998,208 9.7163% 7.8546%
    2       223,710,813,599,232 9.6972% 7.8391%
    3       223,269,824,255,488 9.6781% 7.8237%
    1       217,256,423,740,928 9.4175% 7.6130%
    9       212,058,989,991,424 9.1922% 7.4309%
    0       210,536,903,759,360 9.1262% 7.3775%
    J       210,536,903,759,360 9.1262% 7.3775%
    Q       210,536,903,759,360 9.1262% 7.3775%
    K       210,536,903,759,360 9.1262% 7.3775%
    8       208,060,586,276,352 9.0188% 7.2907%


  • All right folks.

    First off, please understand that having a 1st-card advantage means that the player has somehow found out what the first card of the as-yet undealed coup is.

    This is at worst cheating or at best, if the dealer or procedures are weak, advantage play.

    1st-card advantage is essentially a study of all the possible card permutations that start with Ace through to King that result in a Player, Banker or Tie result from the remaining cards in the shoe.

    The 2 tables below show that knowing that the 1st card is a 1-5 or 10-K, would give a small advantage on the Banker wager. Knowledge of the 1st card being 6-9 would give an increasing advantage on the Player wager, with knowing a 1st card as being 9 giving a 21% advantage on the Player wager.

    Below is a table that shows the probabilities before the start of the shoe:

    Card Value: Player Win Banker Win Tie Player Win % Banker Win % Tie % Player Exp Banker Exp Tie Exp
    1           159,747,170,699,264           189,857,873,692,672          34,887,130,646,784 41.5476% 49.3789% 9.0736% -0.0783 0.0536 -0.1834
    2           160,408,944,947,200           188,725,567,889,408          35,357,662,202,112 41.7197% 49.0844% 9.1959% -0.0736 0.0491 -0.1724
    3           161,429,794,906,112           187,253,976,461,312          35,808,403,671,296 41.9852% 48.7016% 9.3132% -0.0672 0.0428 -0.1618
    4           162,751,823,355,904           184,376,516,966,400          37,363,834,716,416 42.3290% 47.9533% 9.7177% -0.0562 0.0323 -0.1254
    5           166,618,505,969,664           179,969,323,315,200          37,904,345,753,856 43.3347% 46.8070% 9.8583% -0.0347 0.0113 -0.1128
    6           173,075,882,563,584           170,168,183,390,208          41,248,109,084,928 45.0141% 44.2579% 10.7279% 0.0076 -0.0297 -0.0345
    7           185,770,147,510,272           157,451,915,216,896          41,270,112,311,552 48.3157% 40.9506% 10.7337% 0.0737 -0.0941 -0.0340
    8           206,999,120,039,936           140,506,916,139,008          36,986,138,859,776 53.8370% 36.5435% 9.6195% 0.1729 -0.1912 -0.1342
    9           215,108,869,548,032           132,334,879,180,800          37,048,426,309,888 55.9462% 34.4181% 9.6357% 0.2153 -0.2325 -0.1328
    0           638,608,023,052,288           761,607,414,185,984        137,753,262,916,608 41.5228% 49.5203% 8.9568% -0.0800 0.0552 -0.1939

    This table shows the same 16 cards in for each card value, so technically, halfway through the shoe:

    Card Value: Player Win Banker Win Tie Player Win % Banker Win % Tie % Player Exp Banker Exp Tie Exp
    1                2,404,712,210,944                2,862,066,979,328                525,341,662,848 41.5170% 49.4131% 9.0699% -0.0790 0.0543 -0.1837
    2                2,414,405,553,152                2,845,665,957,888                532,049,342,080 41.6843% 49.1299% 9.1857% -0.0745 0.0499 -0.1733
    3                2,427,320,125,440                2,826,650,029,056                538,150,698,624 41.9073% 48.8016% 9.2911% -0.0689 0.0445 -0.1638
    4                2,441,864,919,040                2,787,715,898,880                562,540,035,200 42.1584% 48.1294% 9.7122% -0.0597 0.0356 -0.1259
    5                2,510,828,003,328                2,709,937,753,088                571,355,096,704 43.3490% 46.7866% 9.8644% -0.0344 0.0110 -0.1122
    6                2,609,779,693,056                2,562,217,828,352                620,123,331,712 45.0574% 44.2363% 10.7063% 0.0082 -0.0303 -0.0364
    7                2,801,721,069,056                2,369,605,165,568                620,794,618,496 48.3712% 40.9108% 10.7179% 0.0746 -0.0951 -0.0354
    8                3,123,172,254,720                2,113,348,414,464                555,600,183,936 53.9210% 36.4866% 9.5923% 0.1743 -0.1926 -0.1367
    9                3,240,895,371,776                1,993,736,233,472                557,489,247,872 55.9535% 34.4215% 9.6250% 0.2153 -0.2325 -0.1338
    0                9,633,645,025,280              11,472,680,607,744            2,062,157,779,456 41.5808% 49.5185% 8.9007% -0.0794 0.0546 -0.1989
  • In simulating different conditions of a Baccarat shoe, the following instances were observed:

    1. Wager refers to the wager type studied – Pairs, Wins on Natural 9s (WN9) and Wins on Natural 8s (WN8).
    2. Win % Probability indicates the percentage probability of that result occurring.
    3. Expectation, based on 11:1 for Pairs and 8:1 for Wins on Natural 8s and 9s, shows the expectation (player’s edge) of the respective wagers with the state of the shoe on the right.
    4. 1 – K indicates how many cards of that value have been dealt.
    Wager Win % Probability Expectation 1 2 3 4 5 6 7 8 9 0 J Q K
    Pairs 8.66% 3.9% 5 23 23 23 23 23 23 23 23 23 23 23 23
    Pairs 25.02% 200.2% 5 5 30 30 30 30 30 30 30 30 30 30 30
    WN9 14.27% 28.4% 25 25 25 25 25 25 25 25 5 5 5 5 5
    WN8 13.21% 18.9% 25 25 25 25 25 25 25 5 25 5 5 5 5

    While sufficient randomization would have occurred with the 26-card cut at the end of the shoe as well as with standard burn-card procedures; this table shows that while only under specific circumstances, it IS possible for the expectation of a side wager to turn against the House and towards the player.

    These 4 examples are just some of many possible states.

    In the first Pair example, we see a modest 3.9% expectation for the Player, meaning that the Player is expected to win 3.9 cents on the dollar. As a means of comparison, the 2nd Pair example shows an extreme expectation of 2.002 dollars for the player per dollar wagered.

    Food for thought and perhaps further study.

    Good luck.

  • Why does a Banker win on 6 pay half?

    If you have ever wondered about this, you are not alone.

    This table shows the Probability and House Edge for Baccarat (where Banker wins pay 0.95:1). Notice the House Edge on Banker (in bold):

     Wager  Permutations  Probability  Break-Even House Edge
     Player   2,230,518,282,592,260   0.4462466093                                             1.02768                                          0.012351
     Banker   2,292,252,566,437,890   0.4585974226                                             0.97307                                          0.010579
     Tie      475,627,426,473,216              0.09516                                             9.50906                                          0.143596
     Total   4,998,398,275,503,360

    The House Edge means, theoretically in the long-term, for every dollar wagered, a player is expected to lose 1.05 cents.

    This is a table with the House Edge on Baccarat, comparing what the House Edge would be if Banker were paid half on wins of 1 to 9:

    Banker Win On: Permutations Probability Banker Win on Any Other Result Player Win Difference House Edge
    1         24,291,119,898,624 0.004859781                  2,267,961,446,539,260                  2,230,518,282,592,260 –   49,588,723,896,320.0 -0.009920923
    2         44,681,581,871,104 0.00893918                  2,247,570,984,566,780                  2,230,518,282,592,260 –   39,393,492,910,080.0 -0.007881223
    3         72,927,778,568,192 0.01459023                  2,219,324,787,869,700                  2,230,518,282,592,260 –   25,270,394,561,536.0 -0.005055698
    4      163,359,790,133,248 0.032682428                  2,128,892,776,304,640                  2,230,518,282,592,260     19,945,611,220,992.0 0.003990401
    5      216,715,928,915,968 0.043357075                  2,075,536,637,521,920                  2,230,518,282,592,260     46,623,680,612,352.0 0.009327724
    6      269,232,304,455,680 0.053863716                  2,023,020,261,982,210                  2,230,518,282,592,260     72,881,868,382,208.0 0.014581045
    7      384,279,324,919,808 0.076880493                  1,907,973,241,518,080                  2,230,518,282,592,260   130,405,378,614,272.0 0.026089433
    8      529,914,458,673,152 0.106016854                  1,762,338,107,764,740                  2,230,518,282,592,260   203,222,945,490,944.0 0.040657614
    9      586,850,279,002,112 0.117407667                  1,705,402,287,435,780                  2,230,518,282,592,260   231,690,855,655,424.0 0.04635302

    Notice that on Banker wins on 1 – 3, if the House were to pay half, there would be a long-term negative edge for the House.

    For wins on 4 and 5, the edge is below that of normal Baccarat. At wins on 6, that is where the House Edge comes closest to that of normal Baccarat.

    If the House were to pay half on a Banker win that best profited the House, then the obvious choice would be to pay half on Banker wins on 9, which gives a House Edge 4 times that of normal Baccarat.

    Do realize, that these numbers are based on an 8-deck shoe, before any cards have been dealt. Once cards are removed from the shoe, the probabilities change dynamically.

    Good luck.

  • Baccarat Probability Calculator on Android

    Friends,

    We are pleased to present the eXcelpunks Baccarat Probability Calculator on Android.

    Full version:

    https://play.google.com/store/apps/details?id=com.excelpunks.baccaratprobabilitytrial

    This application determines, based on all card permutations possible, the probability of occurrence of the following wagers:

    1. Player
    2. Banker
    3. Tie
    4. Pair
    5. Natural wins on 8 and 9
    6. Either Pair
    7. Dragon 7 and Panda 8
    8. Player and Banker Bonus
    9. Super 6
    10. Lucky 6
    11. Egalities

    Based on user input of the cards dealt from the shoe as well as the number of coups played, this application gives a report of the following on a card-by-card basis:

    1. Probability of occurrence of that result
    2. Change in probability from coup to coup
    3. House advantage
    4. Kelly Criteria (which recommends the amount to wager)

    Features:

    1. Bankroll tracking with user-set increment values
    2. Adjustment of Kelly Criteria to regulate risk
    3. Saves shoe data for access on re-starting the application

    Usage:

    1. Purchase credits that are consumed each time you use the app.
    2. Purchase a 24-hour time period for unlimited accessibility.

    Do understand that this in no way guarantees or predicts the outcome of the coup.

    These are mathematical and statistical analyses and should be treated as such.

    Good luck.

  • Baccarat Analysis for Players
    1. This analysis spreadsheet is meant for Baccarat.
    2. This spreadsheet computes all the possible permutations of a Player, Banker, Tie or Pair result depending on the:
      1. Number of decks in the shoe
      2. Coups dealt and;
      3. The value and number of cards dealt
      4. A recommendation is also given on where to wager.
    3. NEW Side Wagers:
      1. Power Baccarat (Natural 8 and 9 wins)
      2. Either Pair
      3. Dragon Bonus (Player and Banker Bonus)
      4. Dragon 7/Panda 8 Bonus
      5. Super 6
      6. Lucky 6
      7. Egalities
    4. The memory requirements for this spreadsheet are high, so keep that in mind especially for games with a faster pace (Min. 8GB RAM, though 16GB of RAM is recommended).
    5. This system is a mathematical analysis of Baccarat and is used at your own risk.
    6. Purchase the spreadsheet below – the file will be sent to your e-mail address. Good luck.

    Baccarat Analysis for Players (Excel)

    $188.00

    1. This analysis spreadsheet is meant for Single-Zero and Double-Zero Roulette.
    2. By entering in the results at a table, the spreadsheet will indicate the numbers and areas where results have occurred most often.
    3. Do understand that Roulette is a random game of chance – the results of previous games have no implication on the results of subsequent games.
    4. The spreadsheet will show if there is a bias in the wheel, a dealer with a regular spin or some flaw at the table which causes the game to be not as random as it should.
    5. Use this system at your own risk.
    6. Purchase the spreadsheet below – the spreadsheet will be sent to your e-mail address. Good luck.

    Roulette Analysis Spreadsheet

    $115.00