This is a sample Power BI report:
- 3 databases are used and they have been linked via data relationships
- Measures have been used to generate the Z % statistic
- All data is fictional
This is a sample Power BI report:
This is a sample of how to analyze an aspect of a marketing campaign.
For this example we use a combination of T-tests, along with Hedge’s G and effect size tests to determine statistical confidence and significance. We also used linear regression and standard error analysis to determine the projected efficacy of the campaign.

We were at the aquarium and we saw a pair of siblings, a boy and a girl, run towards an exhibit.
It was one of a few exhibits that only allowed one person to use it at a time. The two then had a dispute over who got there first and who would get to use the exhibit.
This went on for a few seconds when Dad appeared.
Dad could have asked one of them to give way to the other (enforcing a belief in biasness in either or both children), got mad at them (spoiling the day) or left them alone (not a viable solution). He did not. Instead, he interjected himself into the dispute and claimed, “No! It is MY turn!” And proceeded to playfully hog the exhibit.
Dad showed me something today.
1. Using humour can defuse a situation
2. He got his children to focus on him rather than the exhibit
3. He got them to laugh and momentarily, even forget their sibling rivalry
4. He showed that he cared for them both and did not side either one
5. Being a kid with your kids is not always bad
Thanks, Dad!
On 22 Jun 2021, Canada’s Interprovincial Lottery Corporation awarded its largest ever Lotto Max prize pool in the amount of $140 million ($70 million for the grand prize and 70 $1 million MaxMillion prizes).
It thus seems timely to have a look at the math behind lotteries.
The website states that the odds of winning the Lotto Max are 1 in 33,294,800. This is correct to a point, but misleading.
Let’s have a look at the rules of the Lotto Max:
Seeing that players choose 7 out of 50 numbers that are non-repeating, the equation for the total number of possible combinations (this is different from permutations where the order in which the numbers appear is significant) when playing the Lotto Max is:
50! / (7! x 43!)
The ! sign is a factorial. For example, 3! would be 3 X 2 X 1 = 6.
We get 50! as there are 50 numbers to choose from (1 to 50). We get 7! as there are 7 numbers per play. As these 7 numbers are non-repeating, this means that should the 7 numbers be chosen at random, there are 7! ways in which they can be arranged. Hence, the total possible 7-number permutations would be divided by this.
We get 43! (which is really 50-7) as since only 7 numbers are played, the other 43 are discarded.
This gives us 99,884,400. So where does the official 33,294,800 come from?
This is a product of algebraic reduction. We see that though the total possible combinations in the Lotto Max is 99,884,400, each play gets a player 3 combinations of 7 numbers (this is assuming that none of the 3 plays ends up being identical with anyone else’s 3 plays – though that does happen, as it did for this draw, with there being 2 winners).
3 / 99,884,400 gets reduced to 1 / 33,294,800 or 1 in 33,294,800 or 33,294,799 to 1.
This looks like it makes sense till you see that by giving a reduced figure, the real numbers are being obscured from the players. One is not just up against 33 million other numbers, but 99 million. That is a big difference.
It is also interesting that the odds of about 33 million, correspond to the population of Canada at the time the draw was started in 2009. Perhaps to show that everyone in Canada had a chance to win?
So, how does one get the amount of $50 million for the Lotto Max? In order to get an idea of what the Lotto Max can pay out without resulting in a loss of revenue, we would need to look at the breakeven payout.
This is how we calculate the breakeven payout:
33,294,800 – 1 = 33,294,799
($5 x 33,294,799) / 1 = $166,473,995.
So, assuming all things being equal and random, so long as the grand prize does not reach $166,473,995, the house is guaranteed a profit.
We can prove this by calculating the expectation for these values:
3 / 99,884,400 = 0.000000030035 (this is the probability of winning the prize)
99,884,397 / 99,884,400 = 0.999999969965 (this is the probability of losing your $5 play wager)
(166,473,995 x 0.000000030035) – (5 x 0.999999969965) = 0 (this means a breakeven expectation)
One might wonder, does the number of MaxMillion prizes affect my chances of winning? The answer is no. This is because there is nothing that excludes the possibility of the same numbers being drawn for each prize. This means that in essence, all prize draws have the same probability, being independent events. Having more MaxMillion prizes just means that one would be repeating the same draw, again and again with the same probability of winning.
This is how we calculate the expectation – which means how much a player is expected to lose per play, assuming a $70 million prize. This time, we will use the reduced figures and you will see we get the same probabilities. Try it out for yourself:
($70,000,000 X (1/33,294,800)) – ($5 X (33,294,799/33,294,800))
= 2.10 – 4.99
= -2.89
This means on average, every play is expected to gain the house $2.89. This in effect means that most players would in the long run be out $2.89 for every $5 play.
And of course, this wouldn’t be complete without considering the standard deviation of expectation.
| Payment | Probability | Expectation Working | Expectation | Std. Dev. Of Expectation Working | Standard Deviation of Expectation |
| -5 | 0.99999997 | -5 x 0.99999996996528 = | -4.9999998 | 0.99999996996528 x ((-5-(-2.89)))^2 = | 4.42 |
| 70,000,000 | 0.00000003 | 70,000,000 x 0.00000003003 = | 2.1024304 | 0.00000003003 x ((-5-(-2.89)))^2 = | 147170140.90 |
| -4.9999998 + 2.1024304 = | sqrt(4.42021412571428 + 147170140.852618) | ||||
| $ (2.898) | $ 12,131.37 | ||||
| N = | 1,000,000 | -2.89 x 1,000,000 = | 12,131.37 x sqrt(1,000,000) = | ||
| $ (2,897,569.44) | $ 12,131,370.30 |
This means that on average, with a sample size of 1,000,000, meaning 1 million plays, the average revenue for the lottery hosting company would be $2,897,569.44. The standard deviation of expectation for 1 million plays is $12,131,370.30.
The table below shows what this translates to in practice:
| Z | Percentile | +ve | -ve |
| 0.67 | 75% | 5,230,448.66 | (11,025,587.54) |
| 1.03 | 85% | 9,597,741.97 | (15,392,880.85) |
| 1.28 | 90% | 12,630,584.54 | (18,425,723.42) |
| 1.645 | 95% | 17,058,534.70 | (22,853,673.58) |
| 2.32 | 99% | 25,247,209.65 | (31,042,348.53) |
| 3.09 | 99.9% | 34,588,364.78 | (40,383,503.66) |
We get the figures above by taking the mean of $2,897,569.44 and adding or subtracting, depending on whether you are measuring the positive or negative results, by the product of the standard deviation of expectation of $12,131,370.30 multiplied by the Z-score.
For example, let us take a Z-score of 2.32 at 99%. This would mean that the sum of 99% of all winning results, all things being equal, would not exceed $34,588,364.78 while 99% of all losing results, all things being equal, would not exceed -$40,383,503.66.
I hope you enjoyed learning about this. Take care!
eXcelpunks is pleased to present the Roulette Win-Loss Analysis!
This system quickly analyzes if play is suspect on a Roulette session using (1)win-loss, (2)average wager, (3)time played and (4)wagers per hour.
Analyze the win-loss of a Roulette session using:
Try the demo for free at:
https://drive.google.com/file/d/1admTY_WXrUgSLcMwnuqArwG0WdEyeRAx/view?usp=sharing
Get in touch with us at excelpunks@gmail.com!
eXcelpunks is pleased to present the Baccarat Win-Loss Analysis!
This is a system that quickly analyzes if play is suspect on a Baccarat shoe using (1)win-loss, (2)average wager, (3)time played and (4)coups per hour.
Analyze the win-loss of a Baccarat shoe using:
Get in touch with us at excelpunks@gmail.com!

eXcelpunks is pleased to present the Legacy Baccarat Gaming System.
A stand-alone system built for Windows, the system features an easy-install process.
Download for free at:
https://drive.google.com/drive/folders/1vJUG-sGv0CkYjADArPsYSB0cQ9X7mm0f?usp=sharing
Features:
1. Built-in burn card and cut card procedures
2. Use cash chips (with cash value) or promo chips (with no cash value)
3. Purchase cash chips via PayPal using the ‘Cage’ tab – our team will send you a file with the chips loaded within.
Contact us at casinopunks@gmail.com!
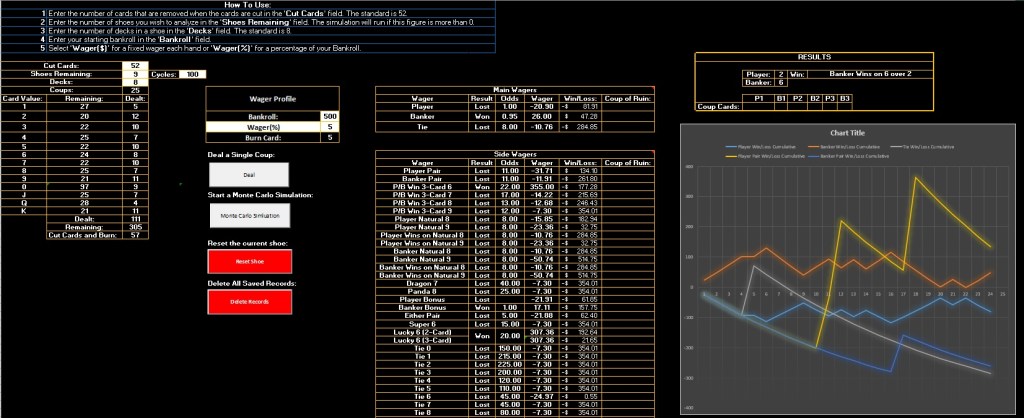
eXcelpunks is pleased to present our Monte Carlo Simulator for Baccarat.
This system simulates play over multiple shoes with customizable settings.
Features:
1. Graph to chart performance
2. Player, Banker, Tie and Pair wagers
3. Over 20 side wagers
4. Records are automatically saved for future reference
5. Set wagering pattern to a flat-bet or a percentage of the bankroll

Monte Carlo Simulator
$1,500.00
Feel free to get in touch at excelpunks@gmail.com!
eXcelpunks is pleased to offer 2 sets of randomly generated baccarat results. Each set has the following characteristics:
1. 100 shoes of randomly generated baccarat results (+7000 coups)
2. Card count for all card values by coup
3. Cards appearing in every coup
4. Final result for Player, Banker and Tie
5. 52-card cut and burnt card programmed into each shoe
Choose from Basic (with the above characteristics)
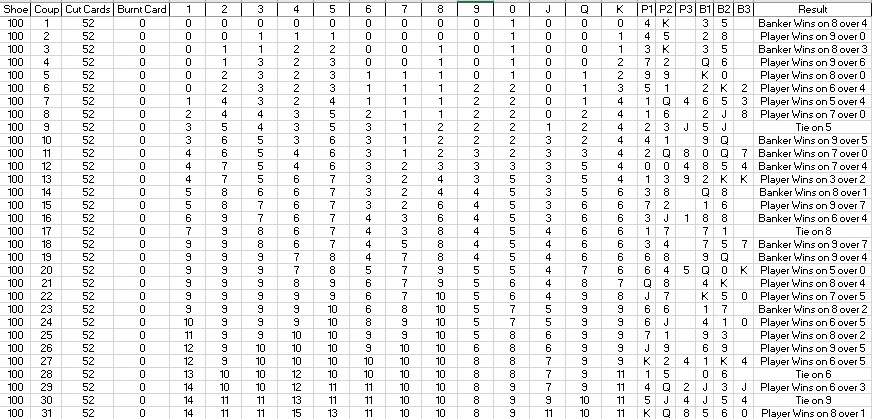
Basic (1 x 100 shoes)
$100.00
or
Advanced, which includes:
Probability, Expectation and Win/Loss for 30+ side wagers including:
1. Pairs
2. Dragon 7 / Panda 8
3. Player and Banker Wins on Natural 8s or 9s
4. Player and Banker Wins on 3-Card 6s – 9s
5. Dragon Bonus (Player / Banker Bonus)
6. Super 6
7. Lucky 6
8. Ties from 0 to 9

Advanced (1 x 100 shoes)
$250.00
Hi friends,
eXcelpunks is pleased to present the Casino Scoreboard for Roulette, Sic-Bo and Baccarat.

Casino Scoreboard
$250.00
Take care!
