• Analyzing Gaming Results using the Binomial Mean and Standard Deviation

    In the previous post, we talked about the mean and standard deviation when analyzing the results of games. We discussed the Central Limit Theorem and how the majority of results of games would fall within the -1σ to 1σ region of a bell-curve.

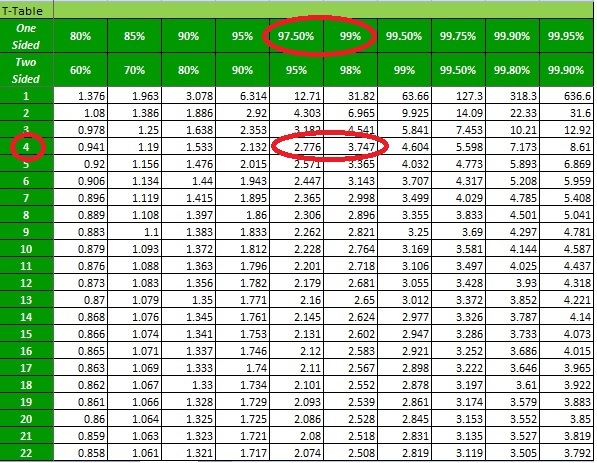
    Here it is again, to jog your memory.

    bellcurve

    (Source: http://schools-wikipedia.org/)

    Getting the mean and standard deviation of data is simple enough if you have a set of data – like when you are analyzing historical records of a current player.

    How about if you only have probabilities such as when you are analyzing casino games and assessing a completely new player?

    Mean

    Let’s use a coin-toss example. Each side of the coin has a 50% chance of appearing or a 0.5 probability.  If we tossed that coin 50 times, how many times are we expecting a heads or tails?  The calculations are as follows:

    Mean = number of trials x probability of winning

    Mean (Heads) = 50 x 0.5 = 25

    Mean (Tails) = 50 x 0.5 = 25

    So, we are expecting that we will get 25 heads and 25 tails from 50 tosses. This sort of calculation is used only for binomial distributions, meaning that the experiments we perform (the coin tosses), have only 2 possible outcomes per experiment. This is similar to most games of chance as well – as in the only 2 possible outcomes being that you either win or lose.

    Let’s try a roulette example. The probability of winning on straight up 10 is 1/38 (for a double-zero game).  What is the expected mean for the result of 10 from 100 spins?

    Mean (Number 10) = 100 x 1/38 = 2.631579 occurrences

    Thus, we are expecting that from 100 spins, the number 10 will occur 2.631579 times.

    Standard Deviation

    Again, note that the calculations we are using are for binomial distributions.

    The calculation for the standard deviation of a coin-toss from 50 tosses is = Square root of (the total number of trials x the probability of winning x the probability of losing) = √50 x 0.5 x 0.5 = √12.5 = 3.535534

    Thus, we are expecting 50 tosses of the coin to produce 25 heads and 25 tails, but that result will face a deviation of 3.535534.

    If we wanted to find out the likelihood of the number of heads or tails occurring, we could do this:

    Probability 2.3% 13.6% 34.1% 50% 34.1% 13.6% 2.3%
    Standard Deviations -3σ -2σ -1σ Mean
    Result 3 x 3.535534 +25 = 14.3934 2 x 3.535534 +25 = 17.92893 1 x 3.535534 +25 = 21.46447 25 1 x 3.535534 +25 =28.53553 2 x 3.535534 +25 =32.07107 3 x 3.535534 +25 =35.6066

    This means that if we conducted multiple experiments where we tossed a coin 50 times, a majority of experiments would have us getting between 21.46447 – 28.53553 tosses of either heads or tails.

    However, if experiments resulted in us getting less than 17.92893 or more than 32.07107 heads or tails, that might be more unlikely.  Unlikely, but not impossible.

    This brings us to…

    Outliers and Inter-quartile Ranges

    An outlier is a result that well, lies outside of the expected.  In some studies, outliers are completely removed from a data set. For us in the business however, it is a cause for concern.  We have already talked about how the majority of results in games would fall within the -1σ to 1σ regions.  This means that an outlier is worth investigating.

    Let’s examine this sample of player results:

    Player Win/Loss
    Player 1 -84
    Player 2 -435
    Player 3 289
    Player 4 -373
    Player 5 218
    Player 6 -315
    Player 7 500
    Player 8 299

    If we arranged all the results in ascending order, we’d get this re-arranged list:

    Player Win/Loss
    Player 2 -435
    Player 4 -373
    Player 6 -315
    Player 1 -84
    Player 5 218
    Player 3 289
    Player 8 299
    Player 7 500

    We will divide this list into 4 like so, naming each segment as a quartile from Q1 to Q4:

    Q1

    Player Win/Loss
    Player 2 -435
    Player 4 -373

    Q2

    Player 6 -315
    Player 1 -84

    Q3

    Player 5 218
    Player 3 289

    Q4

    Player 8 299
    Player 7 500

    The end of Q1 (-373) and the end of Q3 (289) is known as the inter-quartile range.

    This works out to be 373 + 289 = 662

    Anything less than -373 – (1.5 x 662) is an outlier = -1035

    Anything more than 289 +(1.5 x 662) is an outlier = 951

    Do these values then fall outside of the -1σ to 1σ regions?

    Let’s see:

    Mean = -435 + -373 + -315 +-84 + 218 + 289 + 299 + 500 / 8 = 12.375

    Standard Deviation:

    Player Win/Loss Win/Loss – Mean (Win/Loss – Mean)2 Variance Standard Deviation
    Player 2 -435 -447.375 200144.4 129122.3 359.3359
    Player 4 -373 -385.375 148513.9
    Player 6 -315 -327.375 107174.4
    Player 1 -84 -96.375 9288.141
    Player 5 218 205.625 42281.64
    Player 3 289 276.625 76521.39
    Player 8 299 286.625 82153.89
    Player 7 500 487.625 237778.1
    Mean 12.375
    Probability 2.3% 13.6% 34.1% 50% 34.1% 13.6% 2.3%
    Standard Deviations -3σ -2σ -1σ Mean
    Result 3 x 359.3359 +12.375 = -1065.633 2 x 359.3359 +12.375 = -706.2967 1 x 359.3359 +12.375 = -346.9609 12.375 1 x 359.3359 +12.375 =371.7109 2 x 359.3359 +12.375 =731.0467 3 x 359.3359 +12.375 =1090.383

    As it turns out -1035 and 951 fall somewhere between the -3σ to -2σ and 3σ to 2σ regions, respectively.

    Now, do note that this may not ALWAYS be the case, but it is a good gauge of what we want to consider ‘suspicious’.

    Call surveillance!

  • Mean and Standard Deviation in Gaming

    In the previous post, we talked about the long term expectation of games derived from the probabilities of outcomes in casino games.

    How about measuring results in the short-term such as when the results of shoes or player activity appear inconsistent with the expected values?  Let’s face it, they usually do!

    For this, it is useful to apply the principles of the central limit theorem, in particular, the concepts of mean and standard deviation.

    But first…

    Central Limit Theorem

    The central limit theorem explains that the outcome of repeated experiments will follow a bell-shaped pattern.  In terms of casino games, we can translate this as meaning that the outcomes of play will follow a certain pattern of winnings and losses.

    bellcurve

    (Source: http://schools-wikipedia.org/)

    This is a bell-curve, so named due to its shape.

    The bell-curve’s centre is known as the mean or average (µ).

    Notice that the bell-curve is divided into 6 parts from -3σ at the extreme left to 3σ at the extreme right.  The σ symbol means standard deviation.  Thus, the bell-curve is divided into units of 6 standard deviations.

    The central limit theorem explains that for an ideally NORMAL situation, approximately 68.2% (34.1% on either side) of all outcomes will occur within the -1σ to 1σ region, with approximately 27.2% of all outcomes occurring between the -1σ and -2σ regions (13.6%) and the 1σ and 2σ regions (13.6% as well).  The remaining 5% thereabouts is divided into two and occur between the -2σ and -3σ and 2σ and 3σ regions.

    From the bell-curve, assuming you believe it, we can assume that the majority of outcomes will occur within the -1σ to the 1σ region.

    We can translate this into casino gaming, where we can infer that this bell-curve would also apply to the results of games.

    So, how would we know?

    Mean

    The most important part to this question lies in determining the mean or average of the data.  Let’s take this player report as a sample:

    Player Win/(Loss)
    Player 1 $100
    Player 2 ($500)
    Player 3 ($300)
    Player 4 $200
    Player 5 ($100)

    The mean of the win/loss for all 5 players is = $100 + (-$500) + (-$300) + $200 + (-$100) / 5 = -$600 / 5 = -$120

    This means that on average, these players lost $120 each.  So, -$120 becomes our middle point in our bell-curve.

    Standard Deviation

    Now, assuming that an average $120 loss is also true for all players, we can now find the standard deviation.  The calculation is as follows:

    Player Win/(Loss) Win/ (Loss) – Mean (Win/ (Loss) – Mean)2 Variance Standard Deviation = √Variance
    Player 1 $100 $100 – ($120) = $220 $220 x $220 = $48,400 $48,400 + $144,400 + $32,400 + $102,400 + $400 / (5-1) =$328,000 / 4 = $82,000 Square root ($82,000) = $286.3564
    Player 2 ($500) ($500) – ($120) = -$380 -$380 x -$380 = $144,400
    Player 3 ($300) ($300) – ($120) = – $180 -$180 x -$180 = $32,400
    Player 4 $200 $200 – ($120) = $320 -$320 x -$320 = $102,400
    Player 5 ($100) ($100) – ($120) = $20 $20 x $20 = $400
    Mean ($120)

    With a standard deviation of $286.3564 or $286.36, we can apply the probabilities in the bell-curve to the results of games in the short-term.

    Probability 2.3% 13.6% 34.1% 50% 34.1% 13.6% 2.3%
    Standard Deviations -3σ -2σ -1σ Mean
    Result -3 x $286.36 + (-$120) =-$979.08 -2 x $286.36 + (-$120) =-$692.72 -1 x $286.36 + (-$120)=-$406.36 -$120 1 x $286.36 + (-$120) = $166.36 2 x $286.36 + (-$120) = $452.72 3 x $286.36 + (-$120) = $739.08

    What this now means, is that based on our data, the chance of a player losing $120 is 50% and most players will win between $166.36 or lose $406.36.  Wins or losses outside of this range are less likely and thus, more suspect.

    This being the case, we actually now have Player 4 winning $200, which is more than the expected win of $166.36 – we should probably have a look at his play.

    How we will do that will be discussed in a later post.

  • Probability

    The basis of all games of chance is the concept of probability.

    What is probability?  Probability refers to the chance that an event will occur.  Probability is a value that ranges from 1, for an event that will definitely occur, to 0, for an event that will never occur.

    We get the probability of an event occurring by dividing the number of possible ways an event can occur by the total possible number of outcomes for all events.  Let’s illustrate:

    For a 6-sided die, we know that the total number of sides and numbers is 6.  So, for any single roll of the die, we could have any one of 6 possible outcomes.  6 is then the total possible number of outcomes for all events.

    Thus, the chance of rolling any number from 1 – 6 on a roll of the die is 1/6, assuming that the die isn’t loaded (we hope!).

    A variation of this, is the chance that an even number will be rolled.  We know that a 6-sided die has 3 even numbers – 2, 4 and 6.  So that’s 3 possible outcomes / 6 total outcomes.  Thus, the probability of an even number being rolled is 3/6 or 1/2.  In percentages, that’s 50%.

    This changes a little when we move to games like roulette, where the probability of winning is affected by the number of numbers wagered on.  Roulette has 37 numbers from 0 to 36 for a single-zero game and 38 numbers from 00 and 0 – 36 for a double-zero game.

    The probability of winning on a single-number straight up wager is 1/37 for a single-zero and 1/38 for a double-zero game.  However, the probability of winning at all is affected by the total number of wagers placed.  We’ll use the single-zero variant for our examples.

    Thus, if a player bets 15 different straight up wagers on a single game, the probability of winning on any one of those 15 numbers isn’t 1/37 anymore, but 15/37.  The drawback of this method of wagering is that it is overall a poorer choice.  We’ll get to that later.

    Dependent and Independent Events

    A dependent event is an event that is influenced by previous events that preceded it.  An independent event is otherwise unaffected. What does that mean?

    Dependent Events:

    Let’s assume that your friend and you have a single 52-card deck each.  You each take turns drawing a card to see who has the higher value, with the higher value winning, irrespective of suits. Each drawn card is then discarded.

    At the start of the round, your friend draws a King.

    Only an Ace beats that, but since you have 4 Aces in your deck, the probability of you winning by drawing an Ace is 4/52 or 0.076923 or 7.6923%.

    You draw an Ace and win the round.  Now, both of you discard your cards.

    In round 2, your friend draws a King again. The probability of that happening is not 4/52 anymore since a King has already been taken out of his deck.  So the probability of your friend drawing a King is really:

    (4-1) / (52-1) = 3/51 or 0.058824 or 5.8824%.

    Now, for the enthusiasts, the chances of your friend drawing 2 Kings in a row in the first 2 rounds is:

    0.076923 x 0.058824 = 0.004525 or 0.4525% (incredibly small!)

    Independent Events:

    In roulette, the probability of any single number occurring is 1/37.  No matter how many spins have occurred, the probability doesn’t change as the numbers on the layout remain the same, nothing added or subtracted.  This is an example of an independent event, that is unaffected by preceding or future events.  The probability of any single number occurring is 1/37 now and forever.

    A combination of events is a different story.  For someone who has wagered on straight up 35 and also on split 35/36 only, the individual probability of winning is 1/37 for the straight up and 2/37 for the split.

    The probability of them BOTH winning (assuming only 1 wager had been place on both the straight up and the split) is as follows:

    (1/37) x (2/37) = 0.001461 or 0.1461%

    Now, for the enthusiasts, the probability of someone winning on 35 twice in a row?

    ((2 x 1) / ((2 x 1)(0))) x (1/37)2 x (36/37)0 = 0.00073 or 0.073%

    How about winning on 35 two out of three rounds?

    ((3 x 2 x 1) /(2 x 1)(1x 1)) x (1/37)2 x (36/37)1 = 0.002132 or 0.2132%

    Expectation

    No discussion on gaming and probability can be complete without at least broaching expected value.  Expected value is the mathematical probability of winning x winning wagers – probability of losing x losing wagers.

    In roulette, a straight up wager pays 35, thus, the expected value for a straight up wager is =

    (The probability of a straight up win x the amount won) – (The probability of losing a straight up wager x the amount lost) = (1/37 x 35) – (36/37 x 1) = 0.945946 – 0.972973 = -0.02703.

    This implies that overall, in the LONG TERM, everyone who wagers on straight up is expected to lose 0.02703 dollars for every dollar wagered.

    We mentioned why wagering on multiple areas is a poorer choice than just wagering on one.  Let’s calculate the expected value of someone who wagers straight up on 15 numbers.  The overall probability of winning on any one of the 15 numbers is 15/37 or 0.405405 or 40.5405%.  Not too bad you’d think?

    The probability of a win is 15/37, but the amount that would be won is no longer 35, as we have to subtract the amount of losing wagers, so that’d be 35-14.  The losing probability would be 37-15/37 or 22/37 and the amount lost would be 15. The calculation would look like this:

    (15/37 x (35-14)) – (22/37 x 15) = (15/37 x 21) – (22/37 x 15) = 8.513514 – 8.918919 = -0.40541

    So, it looks like anyone wagering this way would over the long term end up losing 0.40541 dollars for every dollar wagered.  Far worse than just wagering on a single number, it seems.

    Designing Games based on Expectation

    Knowing how to calculate expectation allows us now to design and calibrate payments and odds for game wagers.  Let’s look at one of the payments we know of.

    A pair bet on Baccarat pays out 11:1.  What is the expectation of this sort of wager?  Let’s assume a wager of $1.  The probability of a pair occurring is 0.0747.  Thus, the expectation would be:

    (0.0747 x ($1 x 11) – (1-0.0747 x 1) = 0.8217 – 0.9253 = -0.1036.

    This means that for every dollar, the house would win 10.36 cents. Imagine if the payments were lower, like 8:1?

    (0.0747 x ($1 x 8) – (1-0.0747 x 1) = 0.5976 – 0.9253 = -0.3277.

    This means that for every dollar, the house would win 32.77 cents.  That is almost 200% more!  Just by reducing the payment odds.

    Something to ponder, yes?

    The best way to prove something is to take it to extremes. Let’s try this with a single-die wager. A single-die is rolled and players get to wager on numbers 1 to 6. The Sic-Bo payment we know of pays 1:1. As the probability of any of the numbers appearing is 1/6, if a player wagered $5 on number 1, the expectation would be as follows:

    (1/6 x 5) – (5/6 x 5) = 0.833 – 4.167 = -3.333, meaning our friend is expected to lose 3.33 dollars for every $5 wagered.

    As the payment is 1:1, it does not make sense to wager on more than 1 number. What if the payment was raised to 3:1? For a similar $5 wager on number 1, the expectation would be as follows:

    (1/6 x 15) – (5/6 x 5) = 2.5 – 4.167 = -1.667, which is still a safe gap for the house.

    Let’s mix this up a little. Now that the payment is 3:1, our player thinks it gives him a better chance by wagering $5 each on two numbers, say numbers 1 and 3. The expectation would be as follows:

    (2/6 x (15-5) ) – (4/6 – 10) = 3.333 – 6.667 = -3.333

    By doing the maths behind your games, you’d be able to attract players with better odds, so to speak, while still maintaining an edge for the house.

    Closing Thoughts

    So, now you are probably asking – if the expectation is that everyone who plays would lose over the long term, how does one account for all the winners?  Something to think about, which we will discuss in a later post.

  • Do you need to compare results of an experiment or a marketing plan?  Have you just changed the settings of your slot machines and aren’t sure whether the change resulted in a real difference in earnings?  Have you just completed an intensive player promotion programme and need to find out whether it was effective?

    Statistics has a simple way of calculating if the revenue before and after resulted in a real change in performance and also the probability that the change was a DIRECT result of the changes you made!  This method is known as a T-Test.

    A T-Test compares the averages of 2 sets of values and assesses how different the sets of data are.  A companion to this is the R² measure of effect size, which calculates how much in terms of percentages that the results of your T-Test was affected directly by the change you implemented.

    Here’s an example:

    Casino A recently changed the settings of its slots machines and wants to find out if the change resulted in a positive change.

    Here are the earnings of 5 machines BEFORE the change in settings and AFTER the change in settings:

    Slot      Before      After
    1          $10           $20
    2          $14           $45
    3          $12           $25
    4          $8             $15
    5          $16           $32

    Now, we can see intuitively that the change was beneficial, but we normally don’t just compare such a small number – you are normally looking at hundreds or thousands of results.  The results before and after changes may also not be so clearly different.  So, how do you tell?

    Step 1:
    First, we calculate the average of each set of data.  Let’s call them AVERAGE(Before) and AVERAGE(After).

    AVERAGE(Before) = 10+14+12+8+16 / 5 = 12
    AVERAGE(After) = 20+45+25+15+32 / 5 = 27.4
    Step 2:
    Now, we subtract each individual BEFORE result from each individual AFTER result to see what the difference is.
    Slot      After      Before
    1          $20    –   $10 = $10
    2          $45    –   $14 = $31
    3          $25    –   $12 = $13
    4          $15    –   $8  = $7
    5          $32    –   $16 = $16

    Step 3:
    Now, we find the standard deviation of the differences.  We find the standard deviation by the following:

    1. Taking each value and subtracting it from the average of the differences:
    10+31+13+7+16 / 5 = $15.4
    10 – 15.4 = -5.4
    31 – 15.4 = 15.6
    13 – 15.4 = -2.4
    7  – 15.4 = -8.4
    16 – 15.4 = -0.6

    2. Summing the square of each result
    (-5.4)(-5.4) = 29.16
    (15.6)(15.6) = 243.36
    (-2.4)(-2.4) = 5.76
    (-8.4)(-8.4) = 70.56
    (-0.6)(-0.6) = 0.36

    29.16+243.36+5.76+70.56+0.36 = 349.2

    3. Divide the total by the total number of machines – 1.
    349.2/4 = 87.3

    4. Finally, square root the result.

    SQRT(87.3) = 9.343446901
    Standard Deviation of differences = 9.343446901

    Step 4:
    Now, we take AVERAGE(After) – AVERAGE(Before) and divide it by the standard deviation of differences, divided by the square root of the number of machines.

    27.4 – 12 = 15.4
    15.4 / (9.343446901 / SQRT(5))
    15.4 / 4.178516483
    T = 3.685518548

    The T-statistic we get is 3.685518548.  So what do we do with the T-statistic?  This is the interesting part.  We compare this to the T-table, which you can get off the internet.

    T-Table

    We compare the T-statistic with the degrees of freedom (that is just a fancy way of saying the total number of samples -1.  In our case, 5-1 = 4) and then get the probability percentage, which is between 2.5% (100% – 97.50%) – 1% (100% – 99%).

    Which means that the probability of getting this result BY CHANCE is between 2.5% – 1%.  This means that whatever you did, it worked.

    Here’s the formula for a dependent T-test:

    T = mean1 – mean2 / (standard deviation of the differences between sample1 and sample2 / sqrt(n))

    T-Table2

    We mentioned the R² measure of effect size as well.  We use this to find out the percentage that this change in results was directly caused by the change in machine settings.  We find this by taking the square of the T-statistic, divided by the square of the T-statistic added to the number of machines -1.

    T² = (3.685518548)(3.685518548) = 13.58304696
    R² = 13.58304696 / (13.58304696 + 4)
    R² = 0.772508143 or 77.25%

    So, now we know that the probability of this result being achieved due directly to the change is 77.25%.

    Neat!

    This may seem like a lot – so I’ve included a template for download that calculates the T-statistic and R² correlations for you when you enter in sample data.  Just follow the instructions and you’ll get it.

    https://drive.google.com/file/d/0B1pEq2dN7H9ANmhfZzAwOWFJS3M/view?usp=sharing

    You can use the T-Test for anything, really.  You could compare the test scores of your nephew before and after he’s been fed an all vegetable diet, the effectiveness of a marketing plan based on the amount spent by a specific group of clients before and after – you get the idea.

    Have fun!

  • Solutions 4: SkyEye – Table Games

    Requirements: Excel ver. 2007 and above

    Download: get in touch with us at excelpunks@gmail.com

    You’re a casino owner or a gaming manager.  You need to know anything and everything before anyone else does.  AND you needed to know yesterday.  You need to see who your winners, losers and  heaviest hitters are.  And as with all of your fellows, you trust no one more than yourself.

    You COULD hire a whole department to get you the information.  You couldn’t possibly get all that info on your own.  Or could you?

    Excelpunks gets you a mile ahead of everyone on YOUR gaming floor with SkyEye – Table Games!

    Just download your data and with a click of a button, SkyEye automatically:

    • Generates a report on ALL your players and tells you who your top Winners, Losers and Highest Average Betters are!

    SETG Overall

    • Generates a report from over 500,000 unique ratings in under 2 minutes!
    • Generates a report on the winnings and losses of players as a percentage of total wins and losses so you know the impact!

    SETG Summary

    • Generates a report on how much EACH game in your casino is making at once!
    • Generates a report on the winnings and losses of your games as a percentage so you know the impact!

    As with any Excelpunks product:

    • No expensive or fancy software to buy or install!
    • No learning curve!
    • A ‘How To Use’ tab is included with all the instructions you need.

    Always stay a mile ahead of YOUR game with SkyEye – Table Games!

    Get in touch with us at excelpunks@gmail.com for details!

  • 6 Things Every Leader Should Know

    1.  Leader vs. Manager

    Let’s be clear, a leader is not a title or an appointment.  It is someone who performs the activity of leadership.  A leader cares for and develops his people, leads by example, keeps his ear to the ground, is open-minded and willing to change and most importantly, humble.

    A manager is merely an authority.  A manager was conferred authority by someone else and just as arbitrarily as that happened, someone else can take it away.  A manager does things as they have always been done.  A manager is just a channel for instructions.  A manager has no control over his position.

    A leader does, because his leadership does not depend on someone else. It is an inherent trait and is irrevocable.  A leader is the ultimate expression of control and influence – control over oneself and influence among others.

    So you think you can be a leader?  Yes, you can!  Here are 5 things you have to know if you want to lead…

    2.  One Who Everybody Fears, Fears Everybody

    Many managers and supervisors use fear and threats to get others to perform.  To many managers, fear ensures compliance.  Fear ensures order.  Fear ensures results.  Managers who resort to the use of fear often wonder why things fall apart once they are not around.  They then assume that it is the absence of fear that caused it and hence resort to the application of more fear.

    Fear takes away ownership as all activity then is purely motivated by consequences.  Staff run around trying to avoid the consequences rather than aiming for the goal.  When things go wrong, no one wants to bear the blame.  No one is really focusing on the objectives – they are just running from the consequences.

    The manager thus becomes fearful of his staff.  He cannot trust them to obey when he is absent as he is not around to threaten them into submission.  If he cannot trust his staff, he fears what they will do.  If he fears what they will do, he has no influence.  Clearly, this is the path of folly.

    Treat your staff well, trust them to do what they are asked to do and always be open to questions and clarifications.  If they are clarifying with you, it means they care about what they are doing – a sure sign of a good team member.  Build an environment of trust and safety.  We all thrive under those conditions.

    3.  Take Care of Your People and The Business Will Take Care of Itself

    It seems redundant, but tasks do not perform themselves.  No matter how clear the instructions or how simple the task, if done by someone who is unskilled, uninformed or worse, unmotivated, a million things can and will go wrong.

    Conversely, no matter how complicated the task or how ambiguous the instructions, if performed by a skilled, informed and motivated team member, you can be almost assured of a positive outcome.

    It is always a wise decision to invest in your staff.  Develop them, train them and meet their needs and you won’t have to worry when you need someone to walk that extra mile with you.

    4.  Praise Publicly, anything else in private

    The sound of your voice and the words you use set the tone of your environment.  A manager who constantly yells threats at his staff creates an oppressive environment full of anxiety and fear and ultimately, mistakes.

    Worst of all, your authority is undermined if everyone is bad mouthing you behind your back.

    A leader who exhorts and praises his staff creates an environment of calm inspiration.  Your guys know that you appreciate great work and will try to give you that every time.  Who doesn’t like to hear good news at work?

    If you really need to give a reprimand, do it in private and make sure no one else knows about it.  Focus on the future and how the changes implemented will benefit the team.  That way, the team member has something to aim for, rather than something to run from.

    When you use praise, everyone knows where they are heading.  When you use fear, you never know which direction your team will go.

    5.  Train and Develop Your Team

    Not many managers understand the difference between training and development.  Training builds knowledge associated with the current job and is used when a team member is new or unsure of how to perform a task.

    Development aims at promotion.  Development takes into account the team member’s aspirations and abilities to prepare them for the next position.  Development lets a team member know that you are keen to build them up, that you understand their aspirations and that you want them to succeed.

    Training and development, when used appropriately, motivates and invigorates.  It lets your staff know you are looking forward and that you have recognized their potential.  If your staff feel they have a future in the organization, they will be more willing to give their all.

    6.  Work is NOT Life

    Leaders understand that work supports life, not the other way round.  If work was the most essential aspect of life, why spend time doing anything else?  Why study?  Why make friends? Why get married?

    Indeed, a balanced life that is invested in many areas has many benefits.  An active social life, adequate exercise, the pursuit of recreational activities and most importantly, adequate rest leads to a healthier state of mind.  And a healthier state of mind leads to more productivity. It’s a win-win situation when a person succeeds both in his personal life and career.  Of course it’s possible!

    A leader knows that a colleague struggling with a health issue or family turbulence will not be able to give his best.  A leader knows that a balanced investment of time in each aspect of life will benefit all of them.  It’s synergy and a leader ensures that this happens.

    Leaders know when to give time off for great work and for compassionate reasons.  Leaders know that while work gives a sense of self-worth, it is still, just a part of a greater whole.

    Leaders understand life.

  • 5 Ways To Know If You HATE Your Job

    1.  You Are Reading This Now

    Let’s face it.  If you loved your job, headlines like this wouldn’t even catch your eye.  What you are experiencing, is called attentional bias, where your perceptions are affected by your RECURRING thoughts.  Are you having some recurring thoughts right about now?

    What’s that?  You DO love your job?

    So you are reading this now, because?  That’s right, you aren’t SURE if you love your job and you need someone else to validate it for you.

    Here’s another fact, if you love your job, you don’t need someone else to tell you.  You’d know.  Same as you’d know if you love your mother-in-law.

    What’s that?  You DO love your mother-in-law?

    2.  There’s WAY Too Much Time At Work

    You know how it is when you are on your first date?  You pick her up at her house and before you know it, it’s 2a.m. and you are worried that Dad is going to do a Chuck Norris on you. Where did the time go?

    Do you ever catch yourself looking at the clock, again?  Do you complete each task and then whip out your mobile to see how much time has passed?  Do you walk around, well, just to pass the time?

    If you do, then you my friend, hate your job.

    If you loved your job, there wouldn’t be enough time do get things done, at least, not to your level of satisfaction as you’d want things absolutely perfect.  You love what you do!  The day would pass by and before you know it, it’s time to get home.  Boy, you can’t wait for tomorrow.

    Wait, that’s not you?  Read on, my friend…

    3.  You Are Spending More Time In The Restroom

    Yes, all you job haters – busted!  If you find any and every excuse to go relieve yourself, then there’s really one thing behind it.  Well, maybe a dietary issue AND one other thing.

    You need RELIEF from your work and you can’t wait to get away from it.  Really, if you’re doing that, do you really NEED someone to tell you that you hate this job?

    The reason you spend time sitting and thinking – yup, you are thinking and not doing what you are supposed to – is that you are WISHING you were doing something else with your time.  Come on, do you think mobile app games are really for you to use on the TRAIN?

    Or…

    4.  It Makes You Sick

    Or at least, it makes you THINK you are sick.

    Ever wake up in the morning and contemplate, ”Should I just call in sick?”  You then check all your body parts to make sure that nothing is wrong and then curse yourself when you find that you are fine.  Fine and good to go to work.

    If your job is REALLY making you physically sick, I think it’s a good idea to call it quits.

    But, if you are suffering from another kind of job related illness, of the ‘please-make-me-sick-because-I-don’t-want-to-go!’, variety, then you had better re-assess about whether your job is affecting your MENTAL health.

    5.  You Plough Through It For The Kids

    Yes, that’s a favourite.

    You think to yourself, well, thousands of years ago, when humanity was primarily an agrarian society, we’d all be farmers!  Not everyone would have liked that, but they didn’t complain!  True!

    But, don’t you think that thousands of years later, when we’ve sent people to the moon, created wireless technology and now have more variety of occupations than ever before, you’d at least have the opportunity to spend your life doing something you enjoy?

    Have we not even progressed past THAT point in our society, with all our advances in so many other areas?

    We have.  But you need to give yourself the chance to exercise that option.  It is worth the risk doing something you love for a year, than spending 30 years wishing you had

    6.  In Closing…

    Friends, go through life living it.  Don’t settle for second best, or worse, mediocrity.

    Let your day be the best expression of yourself.  At least, give yourself the chance to do that.  Find your passion and pursue it.

    Don’t wake up 25 years from now and think to yourself, well, THAT was a waste of time!  If others tell you to settle, get that decent job and wait for retirement, then they are NOT doing you any favours!  You are essentially occupying yourself till death takes you.

    Don’t live life in regret, or worse, end life in regret.  There’s only 1 life given to each of us.  Spend it the best way you can.

    Good luck!

  • Dear friends,

    As of 9th December 2014, Excelpunks has become an officially registered company!

    Our services include:

    • Data processing
    • Customised Solution Design (programs in pure Excel with any requirement you specify!)
    • Training (from Noob to Advanced – watch out for that!)
    • Consultancy

    As usual, if you have questions, don’t hesitate to comment or send us an e-mail at excelpunks@gmail.com!

    Thanks!

    Josh.

    Owner

    Excelpunks.  Training – Consultancy – Solutions.

  • Requirements: Excel ver. 2007 and above

    Download: get in touch at excelpunks@gmail.com

    Are your regular staff appraisals a pain in the ASS?  Wished you could be spending more time DEVELOPING your staff instead of TYPING about it?  Need an easy way to generate all those forms in 5 MINUTES FLAT?

    Excelpunks’ APPRAISE Staff Appraisal System does just that!  Get all the paperwork done in a flash and spend more time LISTENING and COMMUNICATING with your team!

    • NO expensive or fancy software to buy and install!
    • No learning curve!
    • Customization available upon request!
    • Just load your staff list and the system takes care of everything else!
    • Automatic listings make sure EVERYTHING is spelt correctly and all the details match PERFECTLY!
    • Just select a name and enter a numerical rating – the system does the rest!

    Staff1

    • Automatic dropdown options take care of all the essentials!  Why type EVERYTHING out when you need just a mouse click?

    Staff2

    • Customize your OWN rating system or use APPRAISE’s 5-metric system!

    Staff3

    • Generate a formatted, READY FOR PRINTING staff appraisal report by simply selecting a name!

    Staff7

    Get in touch with us at excelpunks@gmail.com for details!